
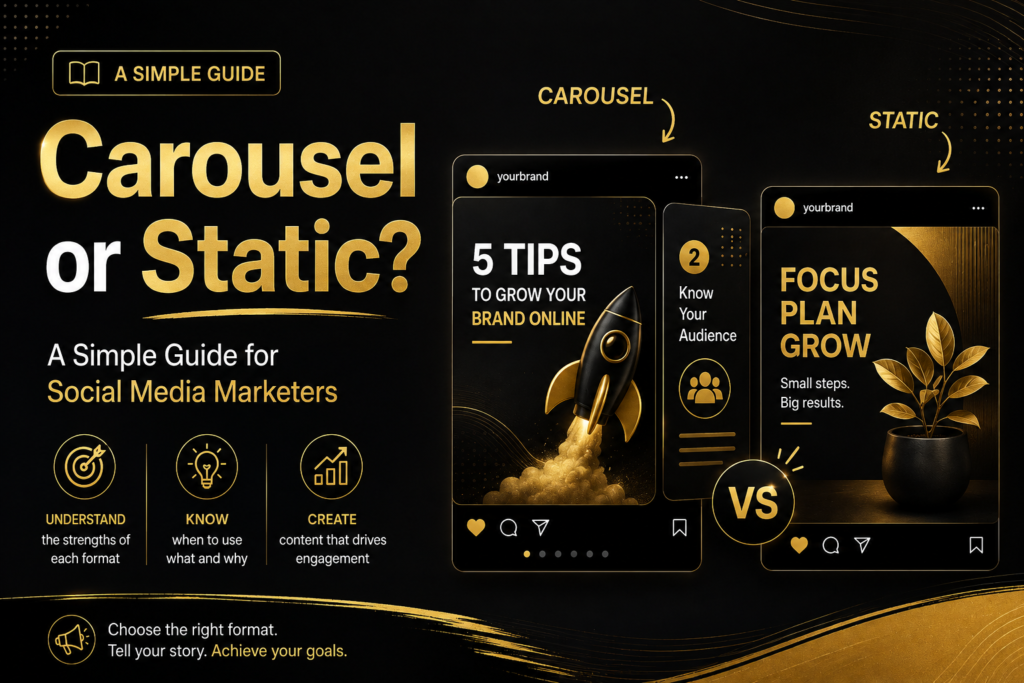
Carousel or Static? A Simple Guide for Social Media Marketers
In 2025, the average LinkedIn carousel, technically called a native document post, earned a 7.00% engagement rate. A plain text post on the same platform earned 4.50% (Socialinsider, 2026). That gap, more than two and a half percentage points, is the difference between content that gets remembered and content that gets scrolled past in half a second.
Every social media marketer eventually faces the same decision: post a single striking image, or build a swipeable, multi-slide carousel. The choice feels small, but it shapes reach, saves, and how long someone actually spends with your brand. This guide walks through what the current LinkedIn and Instagram data actually shows, why carousels tend to win, when a static post is still the smarter call, and a simple framework for the next time you are staring at a blank content calendar.
What’s the Real Difference Between Carousel and Static Posts?
Before comparing performance, it helps to define both formats clearly, since marketers often use the terms loosely.
What Counts as a Static Post
A static post is a single image, graphic, or short video that delivers one message in one glance. A quote card, a product photo, a same-day announcement of a client win, or a plain text update all qualify. The viewer takes in the whole post at once and moves on, with no extra action required.
What Counts as a Carousel Post
A carousel is a swipeable, multi-slide post. On Instagram, it is built from multiple images or short video clips uploaded together, with room for up to ten in a single post. On LinkedIn, the highest-performing version is technically a native document, a PDF uploaded directly to the platform that displays as a series of swipeable slides in the feed (Socialinsider, 2026). Building one typically means designing several coordinated slides in a tool like Canva or PowerPoint, then exporting them as a single file, which is part of why carousels take longer to produce than a single graphic. A five-slide breakdown of a client’s before-and-after LinkedIn profile is a typical example. Both formats ask the viewer to take an extra step, swiping or clicking, before they see the full message.
The Data: How Carousels and Static Posts Actually Perform
Numbers settle more debates than opinions do. Here is what two of the largest recent social media benchmark studies found when they broke down engagement by content format.
LinkedIn: Native Documents and Carousels Lead by a Wide Margin
Socialinsider’s 2026 LinkedIn Benchmarks report, based on an analysis of 1.3 million posts from 16,645 business pages, found that LinkedIn’s overall average engagement rate sits at 5.20%, up 8% year over year (Socialinsider, 2026). Format performance tells a sharper story than that single average.
Native document posts, the carousel-style PDF format, led every other format in 2025 with a 7.00% average engagement rate, a 14% increase year over year (Socialinsider, 2026). Multi-image posts followed closely at 6.45%, then video at 6.00%, single images at 5.30%, and plain text posts trailing at 4.50% (Socialinsider, 2026). By the second quarter of 2026, multi-image posts briefly edged ahead of native documents for the top spot, 6.90% versus 6.60%, a reminder that these two carousel-style formats tend to trade the lead while both continue to beat every other format on the platform (Socialinsider, 2026).
That pattern lines up with how professionals actually use LinkedIn. Where Instagram and TikTok reward entertainment, LinkedIn’s audience logs on to learn, and a multi-slide breakdown of a framework or a step-by-step case study fits that mindset far better than a single image usually can.
The likes data tells a similar story. For pages with 50,000 to 100,000 followers, multi-image posts average 145 likes per post, compared to 100 for single images and just 25 for text updates (Socialinsider, 2026). As a page’s following grows, that gap in favor of multi-image content only widens.
Here is the part most marketers miss. Despite topping the performance charts, brands post native documents only about twice a month on average, and multi-image posts just once a month, compared to seven image posts a month (Socialinsider, 2026). The two best-performing formats on LinkedIn are also the most underused ones.
Instagram: Carousels Hold Their Ground as Overall Engagement Falls
Instagram told a related but different story. Socialinsider’s analysis of 35 million posts across more than 447,000 pages found that overall Instagram engagement dropped 24% year over year to an average of 0.48% (Socialinsider, 2026). Against that decline, carousels proved the most resilient format.
Carousels held steady at a 0.55% engagement rate in 2025, ahead of Reels at 0.52%. Static images fell hardest, down 17% year over year to 0.37% (Socialinsider, 2026). The gap widens further when you look at views. For accounts with 100,000 to 1 million followers, carousels averaged 35,370 views per post, compared to 22,900 for single images and 16,035 for Reels (Socialinsider, 2026). Carousels also produced the highest number of saves at every account size measured in the study (Socialinsider, 2026).
Carousels do not win on every metric, though. Reels still generate more comments at scale. For accounts with 100,000 to 1 million followers, Reels average 60 comments per post compared to 40 for carousels (Socialinsider, 2026). If sparking conversation is the specific goal, Reels remain the stronger choice, even though carousels lead on saves, views, and overall engagement rate.
As on LinkedIn, the format that performs best is not the one brands rely on most. Reels were posted an average of 8 times a month in 2025, images 7 times, and carousels just 5 times (Socialinsider, 2026).
Why Carousels Outperform: The Psychology and the Algorithm
Dwell Time Signals Quality
Both platforms increasingly reward attention, not just impressions. When someone stops scrolling to swipe through several slides, that extra time spent on the post tells the algorithm the content is worth showing to more people. Social media managers interviewed for Socialinsider’s 2026 LinkedIn report describe document posts as free, saveable value on a platform where people are actively looking to learn something (Socialinsider, 2026).
A static post rarely creates that same signal. A viewer can absorb a single image in under a second, which gives the algorithm far less behavioral data to work with when deciding how far to push the content.
The Second Chance Effect
Instagram carousels get a mechanical advantage that no other format receives. If someone scrolls past a carousel without engaging, Instagram will often resurface a different slide from the same post later in their feed, giving the content a second shot at attention (Socialinsider, 2026). That resurfacing is part of why carousels lead in views across every account size in the benchmark data.
Static posts and Reels do not get this second chance. Once a viewer scrolls past, that impression is spent for good.
When a Static Post Is Still the Right Call
None of this means carousels should replace every other post type. Static content still has a clear job to do, and the data backs that up too.
Speed and Timeliness
A single image can go from idea to published post in minutes, while a well-designed carousel takes real production time. When you need to react to breaking industry news, celebrate a same-day win, or share a quick behind-the-scenes moment, a static post gets the message out while it still matters.
Static images also remain genuinely effective on their own terms. HubSpot’s 2025 State of Marketing report found that images rank as the second-highest ROI content format among marketers, named by 19% of respondents, trailing only short-form video at 21% (HubSpot, 2025). Static content is not a weak format. It is simply built for a different job than a carousel.
Simplicity and Single-Message Clarity
Some messages do not need ten slides. A product photo, an event graphic, a customer quote, or one punchy statement often lands better as a single clean image than as a carousel padded out to justify the format. If a viewer has to swipe five times to find one idea, that carousel is really a static post wearing the wrong outfit.
How to Decide: A Simple Framework for Choosing Your Format
Run through these four questions before you open your design tool.
• How many distinct points are you making? One idea leans static. Three or more steps, tips, or facts leans carousel, since frameworks, listicles, and before-and-after breakdowns are exactly what performs best in this format.
• What do you want the viewer to do afterward? Quick awareness favors static. Deeper education, saves, and profile follows favor carousel.
• How much time do you have? Same-day news needs static. A framework, case study, or tutorial can wait the extra hour a well-built carousel takes to design.
• Which platform are you posting to? On both LinkedIn and Instagram, the current data favors carousels for reach, saves, and views, so when a topic could go either way, test the swipe first.
While you test, watch more than the headline engagement rate. Saves and shares tend to signal genuine value, comments show real conversation, and on Instagram specifically, the swipe-through rate to slide two reveals whether your opening slide is doing its job. A carousel with a weak cover image can undercut all of the format’s natural advantages before a viewer ever reaches slide two.
Treat this framework as a starting point, not a rule. Track your own engagement rate by format for a month and let your own numbers, not just the industry benchmark, guide the next decision.
Conclusion: Test the Format Your Data Already Favors
The pattern is consistent across both platforms studied here. Native documents and multi-image carousels are the highest-performing formats on LinkedIn, and carousels are the most resilient format on Instagram even as overall engagement declines (Socialinsider, 2026). Static posts still matter for speed, simplicity, and single, sharp ideas, and they remain a genuinely high-ROI content type in their own right (HubSpot, 2025). The real opportunity, based on the posting frequency gap in both benchmark reports, is that most brands are still underusing the format that performs best.
Look back at your last ten posts. If most of them are static and none are carousels, pick one upcoming topic with at least three distinct points and turn it into a five-to-eight-slide carousel this week. Track its engagement rate against your recent static posts, and let the results, not the benchmark alone, shape your next content calendar.
References
Socialinsider. (2026). 2026 LinkedIn organic benchmarks. https://www.socialinsider.io/social-media-benchmarks/linkedin
Socialinsider. (2026). 2026 Instagram organic engagement benchmarks. https://www.socialinsider.io/social-media-benchmarks/instagram
HubSpot. (2025). State of marketing report 2025. https://www.hubspot.com/state-of-marketing